
AI agent observability is the practice of capturing structured traces, metrics, and evaluation signals from every step an autonomous agent takes, so you can reconstruct why it acted the way it did after the fact.
Without it, an agent's reasoning stays a black box, even when the output looks fine.
Most teams find out their agent observability is missing only after production breaks. A refund agent approves the wrong amount, a coding agent loops for 20 minutes, burning tokens, and nobody can pinpoint the exact step that went wrong.
The logs show input and output. They don't show the decision in between.
This post covers what agent observability requires: the structured traces and trace data, the metrics, the evaluation strategies, and the instrumentation choices that make an autonomous system auditable instead of a black box you hope behaves.
Key insights
- Agent observability differs from APM because the unit of failure is a reasoning step, not a request.
- A complete trace needs a span tree – task, LLM call, tool call – not just input/output logging.
- According to OpenTelemetry's registry, gen_ai.* attributes are now a standardized way to capture agent telemetry across vendors.
- Root cause analysis on a failing agent should take minutes, not a day of log archaeology, once traces are structured correctly.
What is AI agent observability and how it differs from traditional monitoring?
Traditional monitoring tells you a service is up.
Agent observability tells you whether the decision the service made was the right one, and why it wasn't when it fails. It ties agent behavior, agent decisions, and agent performance to the step that produced them.
Defining agent observability and telemetry
Agent telemetry is the structured data an agent emits as it runs: which large language model it called, what tools it invoked, how many tokens it spent, and what it decided at each branch.
This agent telemetry data captures tool usage, retrieving data, and agent execution across the large language models behind each call, from the user intent behind natural language queries to the final API calls.
According to OpenTelemetry's GenAI attribute registry, this now has a standard shape – gen_ai.provider.name, gen_ai.operation.name, gen_ai.request.model, gen_ai.usage.input_tokens, gen_ai.agent.id – instead of whatever fields each vendor invented on its own.
That standardization matters because modern agents, with growing agent capabilities, aren't single API calls. They're loops.
OpenTelemetry's 2026 blog post confirms that VS Code Copilot, OpenAI Codex, and Claude Code all export gen_ai.* telemetry today, with content capture off by default to protect sensitive data.
Telemetry is the raw material; observability is what you build from it.
Agent observability vs traditional APM/monitoring
Application performance monitoring (APM) was built for stateless requests with predictable latency curves.
Agents don't behave that way – the same input can take a different path every time.
3 reasons autonomous agents resist auditing
Most observability stacks were built for services that either succeed or throw an exception.
Agents do neither – they can complete a complex task while making a wrong call on edge cases along the way, and the tooling that watches uptime and latency never flags it.
One habit compounds all three: teams default to checking provider dashboards by hand, tracking tokens and errors but never the reasoning in between, which works for a week and then quietly stops working at all.
These failure modes are why unaudited agents stall in production; from an organizational perspective, see Top 4 AI Governance Challenges in Production.
1. Non-deterministic execution paths
The same prompt can produce a different exact sequence of tool calls on two agent runs.
That's not a bug – it's how LLM-driven planning works, and it means you can't rely on a fixed call graph to know what "normal" looks like.
If you can't predict the path, you have to trace the path every time, not just when something breaks.
2. Hidden reasoning across multi-step tool chains
A single user query on complex tasks might trigger five LLM calls and eight tool invocations across multiple steps before returning a final output.
Input and output logging only shows you the first and the last of those thirteen steps.
Everything in between – the intermediate agent reasoning that decided which tool to call and why – is invisible unless you instrumented it.
3. Silent model drift changing behavior post-deploy
An agent that worked correctly at launch can degrade weeks later with no code change and no deploy.
According to Arize's model drift guide, production teams track this with concrete statistical measures – PSI, KL divergence, JS divergence, Wasserstein distance – rather than gut feel.
Without a drift metric wired into your pipeline, the first sign of the agent's responses degrading is a customer complaint.
What should a complete agent trace capture?
A trace isn't a log line. It's a tree of spans that shows the full shape of a task in generative AI applications, from the moment it starts to every LLM and tool call it spawns along the way.
Governing what enters that context in the first place is Agentic Context Engineering: How to Govern the Knowledge Your AI Agents Read.
The span tree: task, LLM call, tool call spans
According to OpenAI's Agents SDK documentation, the SDK auto-creates distinct span types per run – agent_span, generation_span, function_span, guardrail_span, handoff_span – and ships integrations for over 25 third-party trace processors across many agent frameworks and their specialized tools.
That span typing turns distributed tracing into something queryable instead of just readable.
1{
2  "trace_id": "run_8f2a...",
3  "spans": [
4    {
5      "span_type": "agent_span",
6      "name": "refund_agent.run",
7      "children": [
8        {
9          "span_type": "generation_span",
10          "attributes": {
11            "gen_ai.request.model": "gpt-5-mini",
12            "gen_ai.usage.input_tokens": 412,
13            "gen_ai.usage.output_tokens": 96
14          }
15        },
16        {
17          "span_type": "function_span",
18          "name": "lookup_order",
19          "attributes": {
20            "gen_ai.tool.name": "lookup_order"
21          }
22        },
23        {
24          "span_type": "function_span",
25          "name": "issue_refund",
26          "attributes": {
27            "gen_ai.tool.name": "issue_refund"
28          }
29        }
30      ]
31    }
32  ]
33}
Every span in that tree is a checkpoint you can query later, not a line you scroll past.
The "input and output only" trap
Logging just the user input and the final answer feels like enough, until the agent gives a wrong answer for a right-looking reason.
According to Uptrace's 2026 analysis of OpenTelemetry for AI systems, the correct pattern captures reasoning, tool calls, and tool interactions as span events, alongside the agent's inputs.
Flattening the trace into two fields – what went in, what came out – throws away exactly the data you need during an incident.
Root cause in one span: a refund-agent example
Say a customer support agent handling refunds approves $400 instead of $40. With input/output logging, you see the wrong number and nothing else.
According to Braintrust's practical framework for agent evaluation, a proper trace captures duration, LLM duration, time-to-first-token, token breakdown, and estimated cost at every span, which lets you drill from a failed task score straight to the failing step.
In this case, root cause analysis lands in one span: the lookup_order tool execution returned a stale cached total, and the agent's logic reasoned correctly from bad data.
The bug wasn't the model. It was the tool. You only find that in the span, never in the summary log.
Key metrics for AI agent observability
Metrics without a baseline are just numbers on a dashboard.
The ones worth tracking map directly to where agents fail: the reasoning layer and the end-to-end task.
Reasoning and action-layer metrics
According to Braintrust's overview of LLM monitoring, two signals matter most at the action layer: tool call success rate and agent loop depth, meaning how many iterations a task takes before it resolves.
A rising loop depth with a falling success rate is an early warning sign, well before customers notice anything.
Uptrace's 2026 report also documents the standard metric names worth exporting – gen_ai.client.token.usage, gen_ai.client.operation.duration, gen_ai.server.time_to_first_token – so these numbers are comparable across tools instead of vendor-specific.
End-to-end metrics: success rate, cost, latency percentiles
At the task level, according to arXiv's survey on LLM agent evaluation, the core metrics are Task/Overall Success Rate, time-to-first-token, end-to-end request latency, and cost measured by token count.
Algolia's guide to AI agent evaluation specifies tracking latency as p50/p95/p99, and cost per task as total input plus output tokens across every call the agent makes, which is where you optimize performance.
A p50 that looks fine can hide a p99 that's timing out ten percent of your traffic.
Observability and evaluation: online vs offline
Observability tells you what happened and how the agent behaves. Agent evaluation tells you whether what happened was good.
You need both for a comprehensive evaluation, and they run at different points in the lifecycle.
Compare the AI tools that handle each in AI Governance Tools Comparison (2026): Platforms, Frameworks, and Solutions.
Offline evaluation before deployment
Before an agent goes live, you test it against a fixed dataset of known inputs and expected outputs, scored on objective criteria.
According to arXiv's survey, this is the static half of the evaluation split – a controlled check against ground truth, distinct from the dynamic behavior you see once real traffic hits.
The Langfuse cookbook for the OpenAI Agents SDK frames offline evaluation as running the same dataset repeatedly to catch regressions before a prompt or model change ships.
Online evaluation on live traffic and drift
Once deployed, the questions change: is the agent still performing in real-world scenarios it's never seen before?
According to Langfuse's evaluation cookbook, online evaluation tracks cost per call, per-step latency, user feedback scores, and LLM-as-judge scores on live production runs. Layer drift detection on top of that.
Evidently AI's documentation specifies a default drift threshold of 0.1 using Wasserstein or Jensen-Shannon distance, with an ROC AUC above 0.55 flagging text drift on datasets over 1,000 observations.
Without that threshold wired in, drift shows up as a support ticket instead of an alert.
How to make your AI agents auditable? 3 best practices
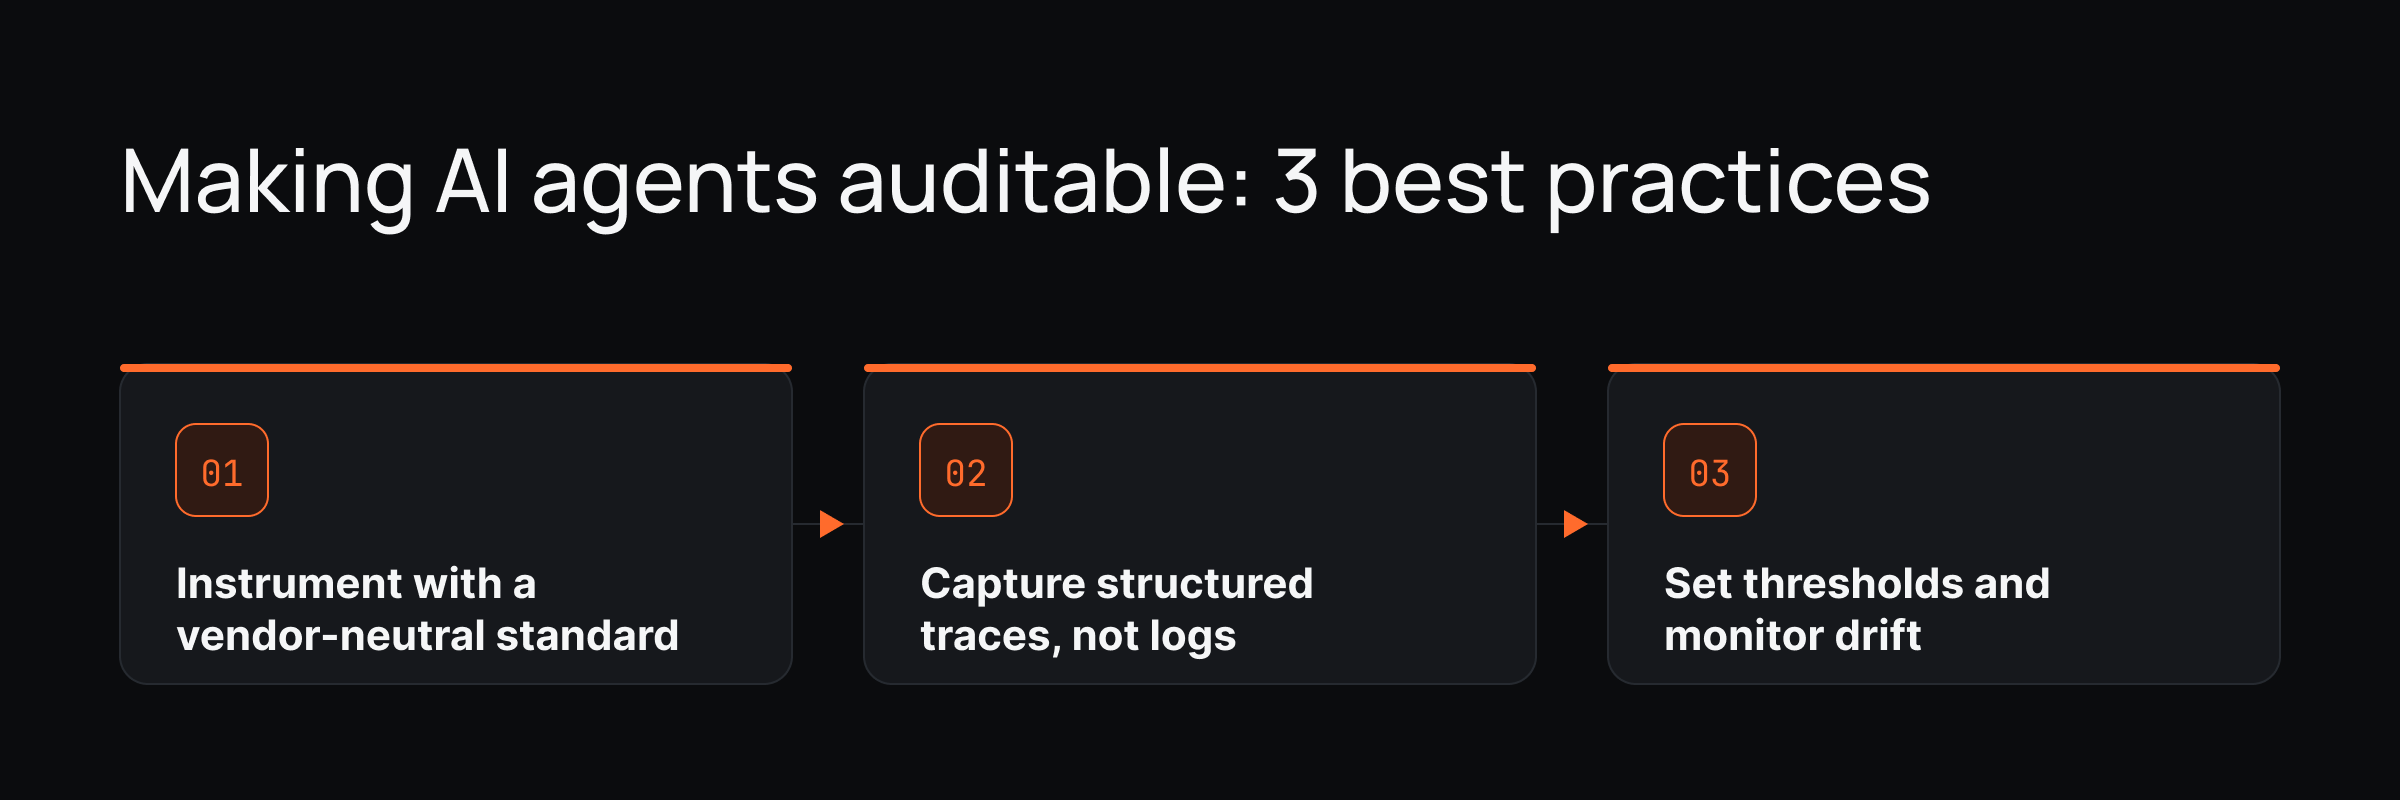
This is the actual build order for teams that build AI agents and want to instrument agents and their agent workflows from day one.
Skip a step and the other two produce less useful data.
To see where agent observability sits in the bigger picture, read AI Governance Solutions: The Complete Guide to Governed AI Engineering (2026)
1. Instrument with a vendor-neutral standard
Don't build a custom telemetry schema.
According to OpenTelemetry's GenAI attribute registry, the gen_ai.* namespace is now at semconv v1.41.0 and covers provider, operation, model, and token usage attributes out of the box.
Datadog's December 2025 confirmation shows this standard has real vendor adoption behind it, not just a spec on paper.
Building on it means you're not locked into one observability vendor's proprietary format two years from now.
2. Capture structured traces, not logs
Wire in span-level capture from day one, recording trace data and tool selection across the task/LLM-call/tool-call tree, not flat request logs.
If you're calling external APIs from your agent, AgentBridge, our open-source framework for structured, auditable agent-API calls, handles this pattern at the integration layer instead of leaving it to each tool call to log itself inconsistently.
# example threshold config for drift + success-rate alerts
metrics:
  tool_call_success_rate:
    warn_below: 0.95
    page_below: 0.85
  agent_loop_depth:
    warn_above: 6
  drift_score:
    method: jensen_shannon
    warn_above: 0.10
3. Define metrics with thresholds, run both evaluation modes, and monitor drift
Set explicit thresholds, not "check it occasionally." Arize's guide to model drift lays out the PSI formula alongside KL divergence, JS divergence, and Wasserstein distance as concrete production drift metrics you can alert on.
Run offline evaluation on every change before it ships, and online evaluation continuously after.
A threshold without an evaluation cadence behind it is just a number nobody checks.
Check where you stand today in the AI Governance Maturity Model: From Vibe-Coding to Governed Velocity.
Auditability in practice: the Atlas Monitor phase

Atlas is Blazity's answer to the problems above: an AI governance solution for the engineering process, not a platform that demands you move everything onto it. It puts repo-owned context, rules, skills, review artifacts, and workflow governance inside your development lifecycle.
Atlas Core is the managed context substrate (repo memory, rules, skills, templates, review artifacts) that the agent reads, so knowledge stops being scattered.
Quality gates, evaluations, and self-validation address slop when they are part of the workflow around the agent, not just a prompt instruction.
AI Workflow is the implementation surface for the ticket-to-PR path: a defined route from ticket to pull request to governed merge, with machine-enforced gates that the workflow owns.
Observability should record the agent run, decisions, tool calls, context, and failed checks as evidence. Atlas connects those artifacts to the repo-owned process rather than becoming a separate black-box platform.
Turning that evidence into SOC 2 and HIPAA proof is covered in AI Governance Compliance: How to Keep AI-Generated Code Secure and Compliant (SOC 2, HIPAA).
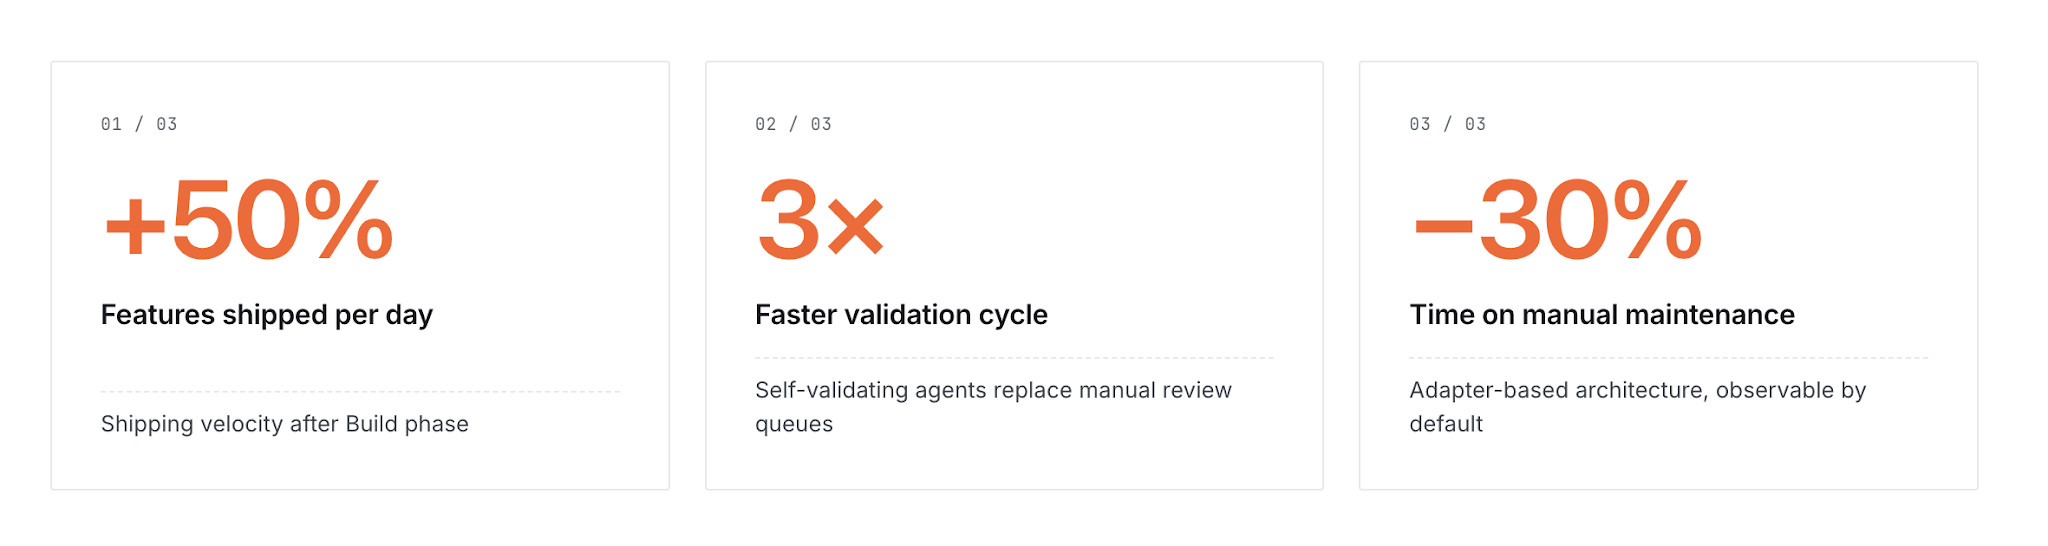
Teams use Atlas to target outcomes like +50% features shipped per day, 3x faster validation cycles, and -30% time on manual maintenance, depending on workflow maturity and adoption. The payoff is directional, not a guaranteed benchmark.
Atlas is built to govern the engineering process you already run, not to replace it, which is what "autonomous, but governed" means in practice. It starts from repo-owned context and review artifacts, then connects to workflow, gates, and observability where those surfaces are implemented. See the GitHub repo.
Summary: Where to start?
Start with an inventory, not an observability-tool purchase. If you can't name every span your agent produces on a single run, instrumentation comes before dashboards.
An architecture and code review to map what your agent is actually doing before you scale it is usually faster than guessing.
If the code is sound but the telemetry is missing, that's a different problem, whether you run one agent or multiple AI agents across complex workflows.
For that, we built Atlas - durable, observable agentic workflows on the Vercel AI stack with full observability across logs, traces, run history, and failure diagnostics from the first deploy.
If observability is one symptom of a bigger set of issues, a tech audit scoping performance, code quality, and security findings by business impact will tell you where agent reliability ranks against everything else competing for your roadmap.
And if you're designing the system from scratch, enterprise solution architecture with monitoring and observability dashboards built in avoids retrofitting telemetry onto an agent that was never designed to expose it.
Whichever path fits, talk to an architect about your agent's audit trail before the next incident forces the conversation.
FAQ on AI agent observability
What's the difference between agent observability and LLM observability?
LLM observability tracks a single model call – prompt, completion, tokens. Agent observability tracks the whole task: every LLM call, every tool call, and the reasoning path connecting them.
Do I need distributed tracing for a single agent?
Yes, once the agent makes more than one call per task, and even more so for stateful agents. A single agent invocation can spawn a dozen spans across models, tools, and multiple agents, and you need the tree structure to debug any of them.
How do I detect model drift in a production agent?
Track statistical distance between current and baseline output distributions. According to Evidently AI's documentation, a Wasserstein or Jensen-Shannon distance above 0.1 is a reasonable default threshold to alert on.
Does agent observability replace evaluation?
No, observability shows you what happened in production. Evaluation, run offline and online, tells you whether the behavior was correct.
What's the fastest way to start instrumenting an existing agent?
Adopt the gen_ai.* OpenTelemetry conventions first. According to OpenTelemetry's attribute registry, this gets you span structure and standard metric names without building your own schema. It works the same for LLM-based agents and multi-agent systems.
Sources
- OpenTelemetry GenAI Attribute Registry
- Datadog: LLM Observability natively supports OpenTelemetry GenAI Semantic Conventions
- OpenTelemetry for AI Systems: LLM and Agent Observability - Uptrace
- Inside the LLM Call: GenAI Observability with OpenTelemetry
- Tracing - OpenAI Agents SDK
- Evaluation for the OpenAI-Agents SDK (Langfuse cookbook)
- Evaluation and Benchmarking of LLM Agents: A Survey - arXiv
- AI agent evaluation: frameworks, metrics & testing strategies - Algolia
- What is LLM monitoring? - Braintrust
- AI agent evaluation: A practical framework for testing multi-step agents - Braintrust
- Data drift - Evidently AI Documentation
- Model Drift: A Guide to Understanding Drift in AI - Arize
%201.svg)